Dashboard Overview
Dashboard Overview
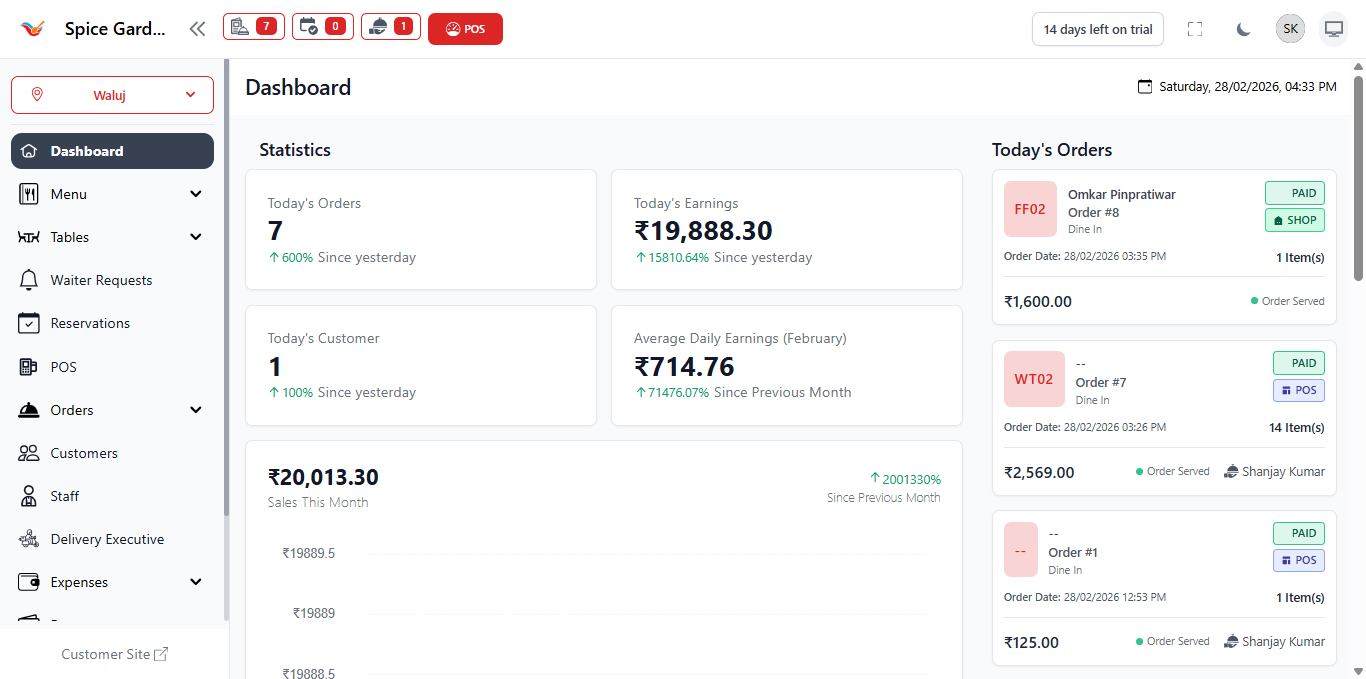
The Dashboard is the central control panel of your restaurant management system. It provides real-time operational insights, financial summaries, order tracking, and performance analytics in one unified interface.
1. Top Navigation Bar
The top navigation bar provides quick access to global system controls and status indicators.
Available Controls:
- Branch Selector – Switch between different restaurant branches (if multiple branches are added).
- Notification Indicators – Displays pending KOTs, order alerts, or system updates.
- POS Shortcut – Direct access to the POS interface for faster order processing.
- Trial Status Badge – Displays remaining trial days (if applicable).
- User Profile Menu – Access account settings, logout, and profile management.
- Dark Mode Toggle – Switch between light and dark interface modes.
2. Sidebar Navigation Panel
The left sidebar provides structured navigation to all core system modules.
Main Modules:
- Dashboard – Performance summary and analytics.
- Menu – Manage menus, categories, items, and modifiers.
- Tables – Configure dining areas and table layouts.
- Waiter Requests – Monitor service requests.
- Reservations – Handle table reservations.
- POS – Process live customer orders.
- Orders – View and manage historical orders.
- Customers – Manage customer records.
- Staff – Manage staff roles and permissions.
- Delivery Executive – Manage delivery personnel.
- Expenses – Track operational expenses.
3. Statistics Summary Cards
The top section of the dashboard displays daily performance indicators through summary cards.
Key Metrics Explained:
-
Today's Orders
Total number of orders created today. Includes dine-in, POS, and online/shop orders. Displays percentage comparison with yesterday. -
Today's Earnings
Total revenue generated today. Automatically updates as payments are completed. Includes growth comparison with previous day. -
Today's Customers
Total number of unique customers served today. -
Average Daily Earnings (Monthly)
Calculates the average daily revenue for the current month. Displays percentage growth compared to previous month.
4. Sales Performance Graph
The Sales This Month section provides a visual representation of revenue performance.
What It Shows:
- Total revenue for the current month
- Graphical timeline of daily sales
- Percentage growth compared to previous month
This graph helps identify peak business days, slow periods, and overall growth trends.
5. Payment Method Breakdown
Displays how customers paid for orders today.
Includes:
- Cash payments
- UPI payments
- Card or integrated gateway payments
This helps you analyze preferred payment methods and reconcile daily cash flow.
6. Top Selling Dishes
Shows the most frequently ordered menu items for the day.
Details Displayed:
- Item Name
- Total Quantity Sold
- Total Revenue Generated
This data assists in menu optimization, inventory planning, and promotional decisions.
7. Top Selling Tables
Displays which tables generated the highest revenue for the day.
- Table Identifier (e.g., WT01, FF02)
- Total Sales from that Table
Useful for analyzing seating utilization and service efficiency.
8. Today's Orders Panel
The right-side panel lists all orders created today in chronological order.
Each Order Card Displays:
- Order Number
- Order Type (Dine In / POS / Shop)
- Customer Name
- Date & Time
- Total Amount
- Payment Status (Paid / Pending)
- Order Status (Preparing / Served)
Clicking an order opens detailed order information for further actions such as:
- View KOT history
- Process payments
- Print bill
- Update order status
9. Business Decision Support
The dashboard is designed to support real-time business decision-making. By analyzing the displayed metrics, restaurant owners can:
- Monitor daily revenue targets
- Track order growth trends
- Identify high-performing dishes
- Improve table turnover efficiency
- Manage cash and digital payment balance