Items Report
Item Report
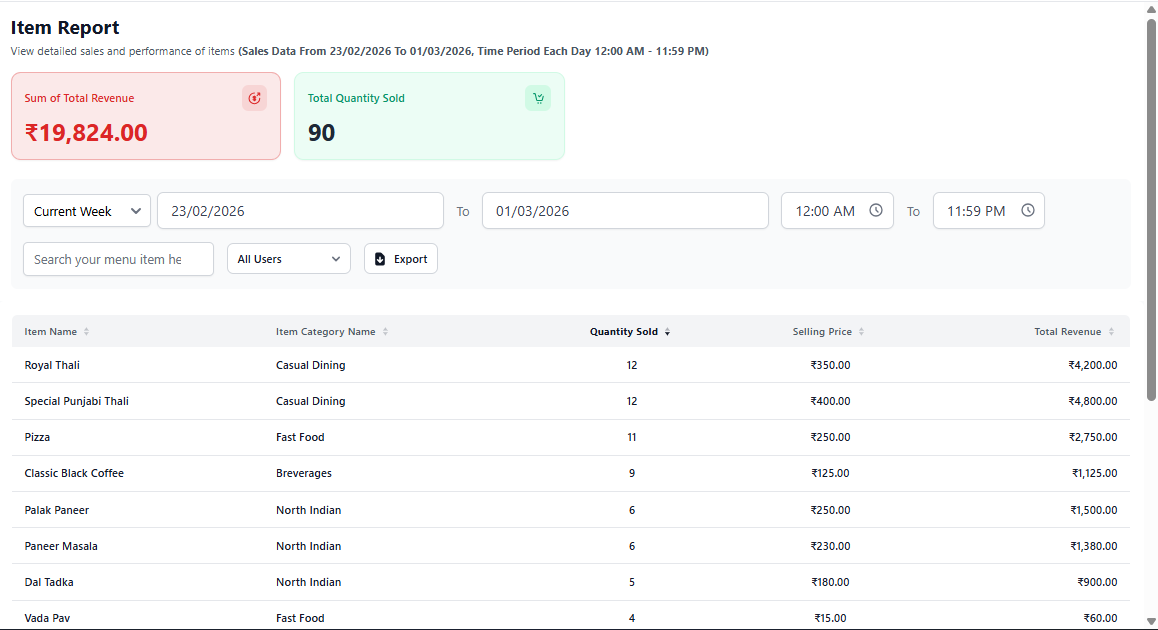
The Item Report provides detailed insights into the performance of each menu item. It helps restaurant owners understand which dishes sell the most, generate the highest revenue, and contribute to overall business growth.
1. Report Summary Overview
The top summary cards display quick performance indicators:
- Sum of Total Revenue – Total income generated from all menu items.
- Total Quantity Sold – Total number of items sold during the selected period.
These metrics help identify overall menu performance instantly.
2. Date & Filter Options
- Select predefined time ranges (Today, Week, Custom).
- Choose Start Date and End Date.
- Set reporting time range.
- Search specific menu items.
- Filter report by system users.
- Export report for analysis or accounting.
Use filters to analyze performance during peak hours or special events.
3. Item Performance Table
The table displays detailed analytics for each menu item:
- Item Name – Name of the menu item.
- Item Category – Category assigned to the item.
- Quantity Sold – Total units sold.
- Selling Price – Price per item.
- Total Revenue – Revenue generated by the item.
This section helps identify best-selling and low-performing menu items.
4. Business Insights You Can Gain
- Identify top-selling dishes
- Remove low-performing menu items
- Optimize pricing strategy
- Plan inventory based on demand
- Understand customer preferences
- Create promotional offers for slow items
5. Best Practice for Restaurant Owners
- Review item report weekly.
- Highlight top 5 revenue-generating dishes.
- Adjust menu placement based on popularity.
- Track seasonal demand patterns.